A Data-Driven Approach to Trading Crude Oil
Aug 9, 2021
By Frank Kaberna
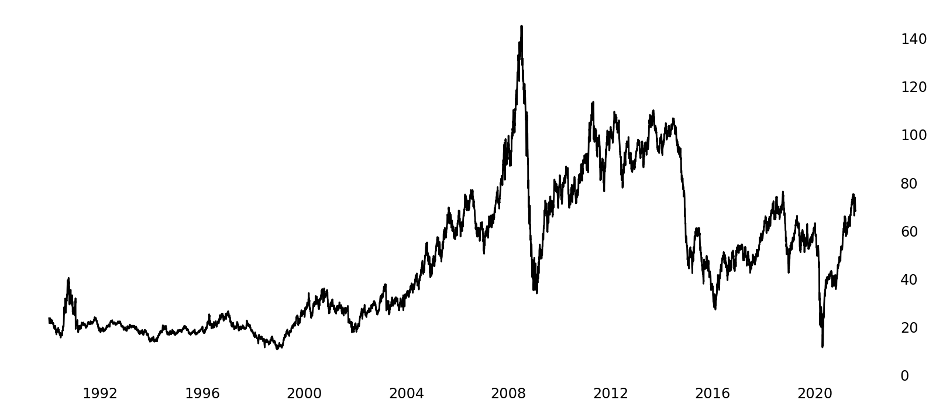
Crude oil can be viewed as one of the few markets that trades in a range; that is, the price of a barrel of crude has been as high as $145 and as low as $10 while always existing somewhere in between.*
Crude Oil Price History

Source: US Energy Information Administration (eia.gov)
In the same time that the range for stocks like AMZN can shift higher by $100s or even $1,000s every few months, crude oil has rallied to but not topped $75 on multiple occasions.† Commodities are often popular day trades for their range-bounded and mean-reverting attributes, but traders can be reluctant to jump on the action when crude starts moving multiple dollars per day as it did last week.
Decrease Memory, Increase Data
Those who sold $100 crude as it blew up to $140 in 2008, or bought $30 oil before its brief collapse below $0 in 2020, know that mean reversion works until it doesn’t. Outliers can cause hesitation for even the most mechanical people, but some of the best day traders live in the moment with no fear of the past. How do they do it?
SMO \ A Day in the Life

Source: dxFeed Index Services 5/1/21 to 8/4/21 (https://indexit.dxfeed.com)
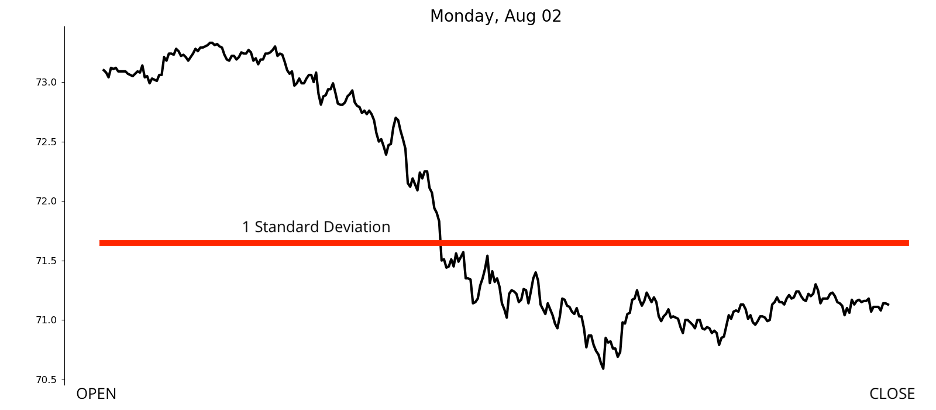
Data can reduce emotion and other irrational influences to help create memoryless strategies that only act on statistical edges in the market. The standard deviation on SMO, for example, shows a 68% chance of Small Crude Oil futures closing in its range. Data-driven traders can buy or sell outside of that range on a net change basis with their 68% edge while giving no thought to yesterday.
68% of the Time, It Works Every Time
But, of course, data does not hold 100% of the time. The standard deviation is in fact designed to be wrong 32% of the time, since, if it were correct 100% of the time, the market would never reach those bounds. The idea is to reduce losses to the same amount as gains on those 32% days by defining risk in futures and taking losses at predetermined levels.
SMO \ Last Monday in the Life

Source: dxFeed Index Services (https://indexit.dxfeed.com)
For example, if you bought SMO around its 1 standard deviation on Monday, August 2nd, and took a $50 loss, you could have bought SMO around the same net change level on the following Tuesday and Wednesday and taken $50 profits from both.
The fear of what could happen will always be there, but data can help traders forget their memory and take advantage of the opportunity at hand.
Get Weekly Commentary on Small Markets!
To learn more about trading the Smalls, sign up for our free weekly newsletter which covers everything from stocks and bonds to commodities and foreign exchange.
*Spot crude oil prices from 1/1/90 to 8/4/21 from eia.gov
†AMZN and spot crude oil prices from 1/1/18 to 8/4/21 from finance.yahoo.com and eia.gov, respectively


